
Context
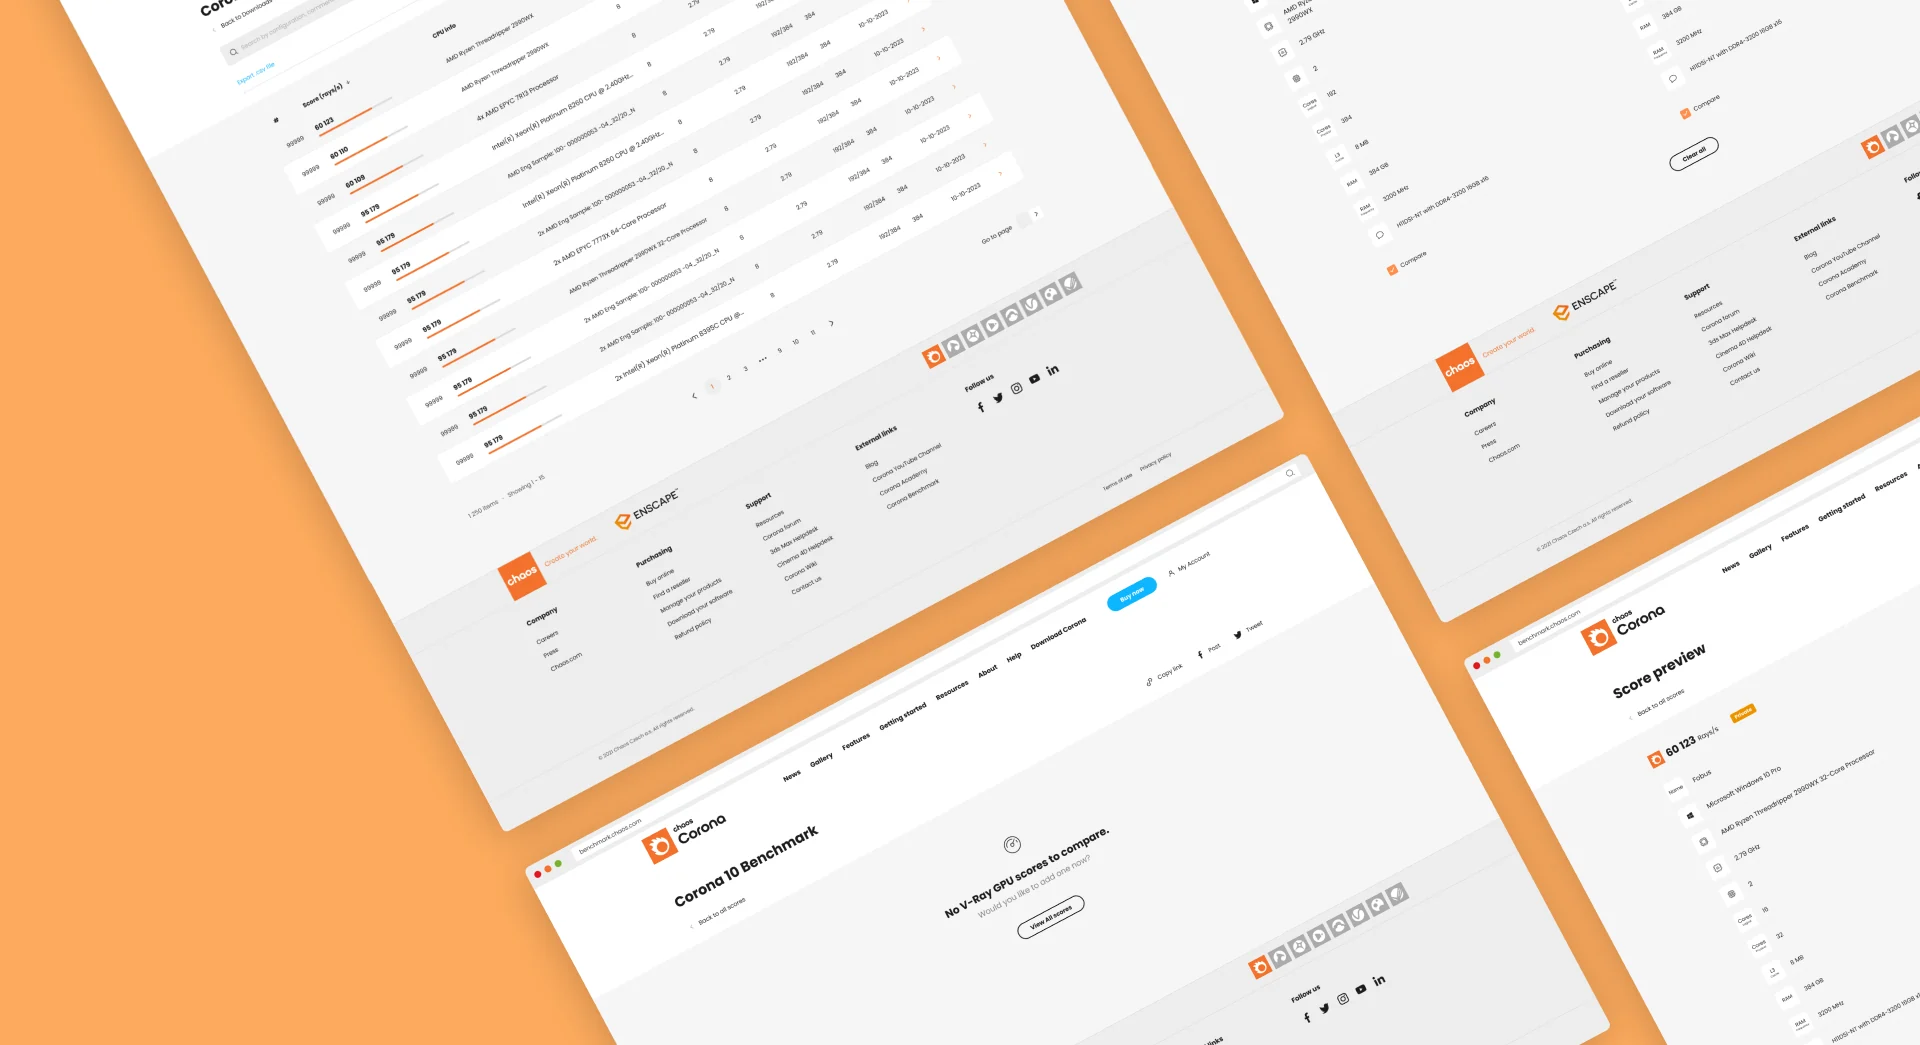
Corona Benchmark measures rendering performance using the Corona 10 core. The web scoreboard helps users compare results from different hardware configurations. This case covers my design of the scoreboard, filters and comparison interface.
Four tasks behind a dense table.
The brief was to make benchmark results easy to inspect and compare. Working with stakeholders, I defined four core tasks: find a score, filter the results, inspect a hardware configuration, and compare or share results.
Find, filter, inspect and compare.
I mapped the paths from the scoreboard to a hardware detail view, comparison and sharing. The flow helped stakeholders review the scope and agree on how the screens should connect.
Compare up to three rigs in one view.
The design of the Corona Benchmark Scoreboard is built around the existing design system and is similar to the V-ray scoreboard to stay true to the distinctive visual style of Chaos products. I made some adjustments to the design system to better cater to the needs of Corona users.
The final design enables users to compare and filter the score list using built-in filters and to compare up to three rigs on a single screen. Additionally, users can easily share their results on social media using the integrated share buttons.
Keep the core tasks across screen sizes.
I adapted the scoreboard for mobile and created a dark theme. Both versions retain the same core tasks: reviewing scores, filtering results and comparing hardware configurations.
Part of the Corona product ecosystem.
The scoreboard shipped as part of Corona's product ecosystem, giving users a transparent way to benchmark and compare rigs. The main design challenge was making dense comparison data scannable without overwhelming casual users. If you would like to test this product yourself, please follow this link and evaluate the work firsthand.